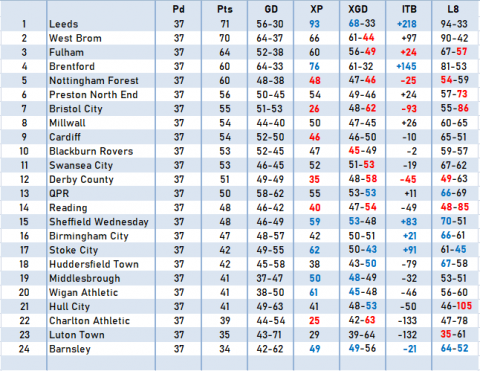
Championship updated XP and ITB stats .............

Pd = games played.
Pts = points
GD = goal difference
XP= expected points
XGD = expected goal difference
ITB = inside the box net numbers for the season
L8 = inside the box totals (created-conceded) for the last 8 games.
At present I am undecided whether to go with 8 or 6 games for the last column, but it probably doesn't overly matter as I will be looking for changing trends over shorter periods than that in any case and highlighting those within the matchday previews.
I am also considering adding an additional column or two relating to individual team ratings, but am in two minds about this at present.
Anyway, back to the table above. The first three columns are "real" in terms of points won and goals scored/conceded, but league tables do sometimes "lie" even after 37 games and the last four columns are more interesting as they show performance levels and who has been over/underachieving in front of goal at both ends of the pitch.
The numbers which are shown in blue type indicate teams who are playing above the level of their current league position, those in red for teams who have outperformed their stats and we would normally expect results for the former to improve and the latter to fall away. Double or treble (or more) blue or red numbers are especially noteworthy.
I will finish with my normal observation that : I like expected goals/points, but IMO, it is easier to see the direction teams are heading with ITB if only because there are more numerically and the swings quicker to pick up on. But I also think they highlight the flow of games and the superiority, or failings of teams, better.